Viewers
Viewers can be used within the MMLF Explorer GUI to monitor online the progress of a learning agent while he is interacting with the environment.
General-purpose
- TrajectoryViewer
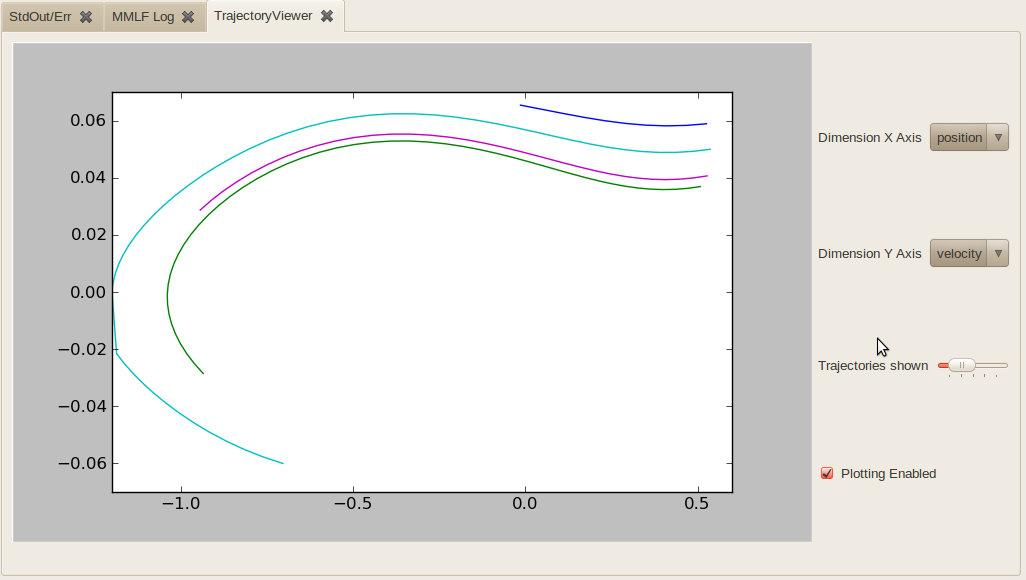
The TrajectoryViewer allows to visualize trajectories (the pathes an agent has taken through the state space in an episode). For environments with more than two dimensions, one can specify which two state dimensions are shown. The other dimensions are ignored. Onecan also choose how many trajectories (i.e. episodes) are shown at a time.
- FloatStreamViewer
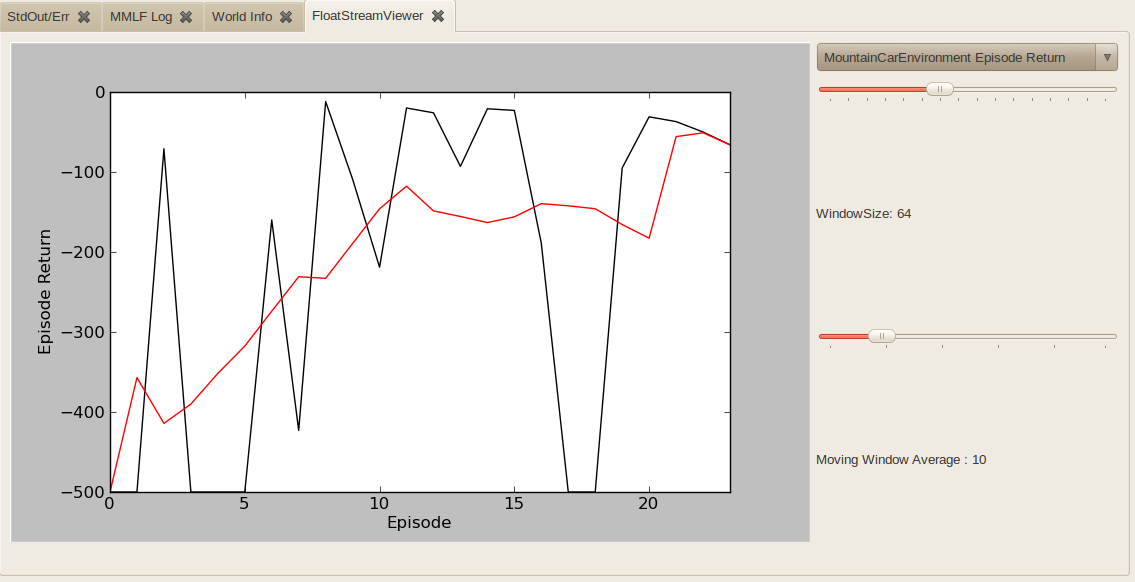
The FloatStreamViewer allows to show how a scalar metric (like the return per episode, the episode lentgth etc.) change over time. It shows the development of this metric as well as a smoothed moving-window-average of the metric. It allows to configure which window of time (e.g. how many episodes) are shown at a time and over how many values the moving-window-average is computed. Any observable of type FloatStreamObservable defined in environment or agent may be visualized.
- ModelViewer
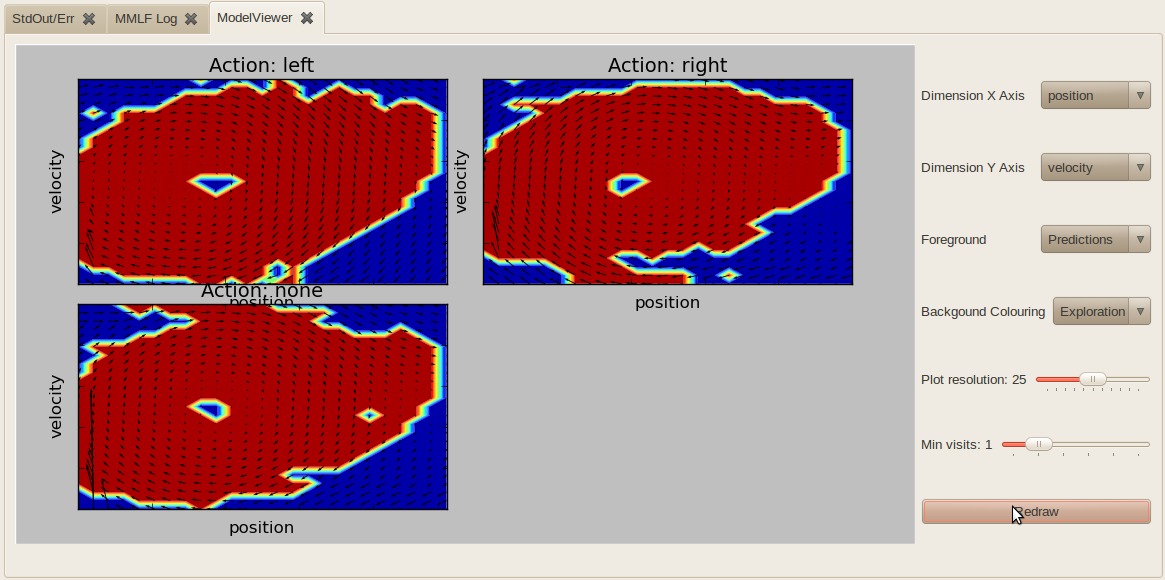
The ModelViewer is available when using an agent which internally learns a model of its environment. It currently supports only continuous state spaces and is most useful when the state space is two-dimensional (e.g. in mountain-car). For higher dimensional state spaces, one has to select two dimensions (“Dimension X axis” and “Dimension Y axis”) which are plotted. For the remaining dimensions, a default value is assumed. One can either plot the model’s predictions (Foreground=Predictions):
or plot which state-action combinations have been explored by the agent (blue dots, Foreground=Samples):
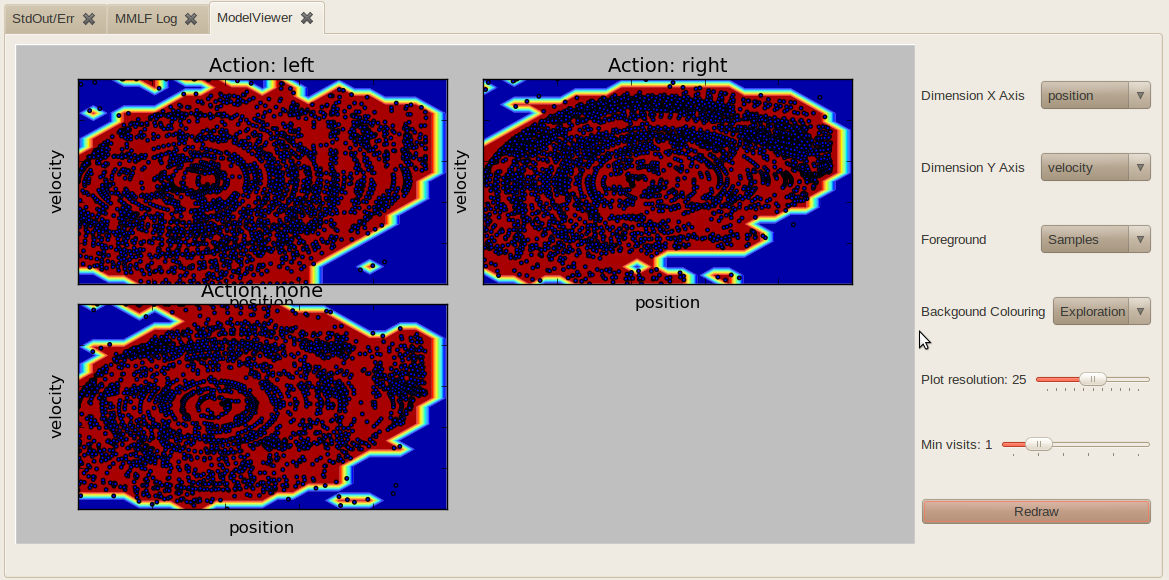
In the background, one can either plot the expected immediate reward for a state-action combination (color-coded) or the exploration value (how “explored” a certain region of the state-action space is). For the latter, one can define a threshold “Min visits” which specifies how many visits of a state-action pair are required to be considered as explored. Since the state space is continuous, visits are usually distributed over a local neighborhood. Furthermore, “Plot resolution” defines the resolution N of the 2d grid (N*N nodes) which is layed over the 2d state space. The higher the resolution, the slower the plotting becomes.
Environment specific
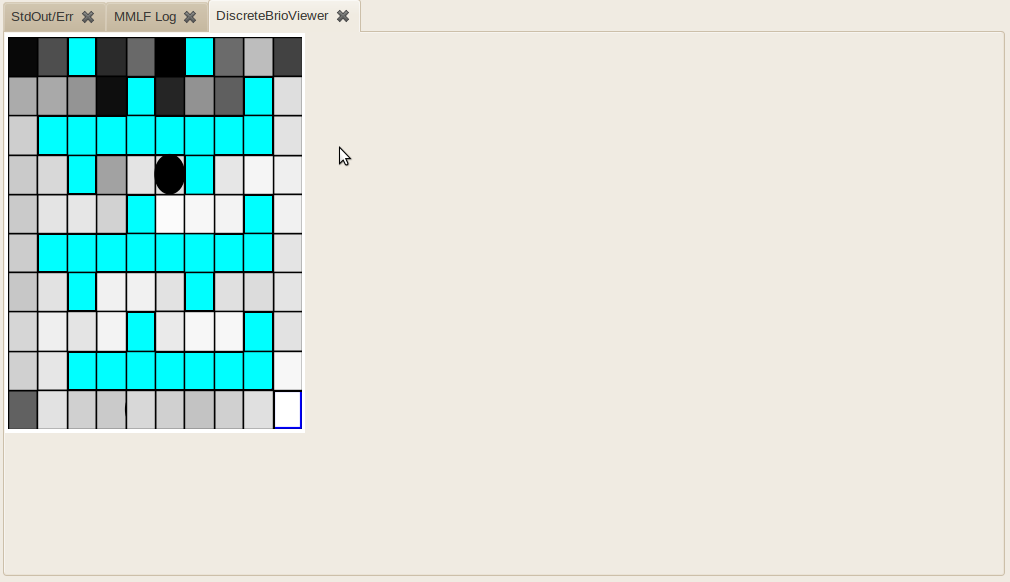
- DiscreteBrioViewer
- Maze2DDetailedViewer
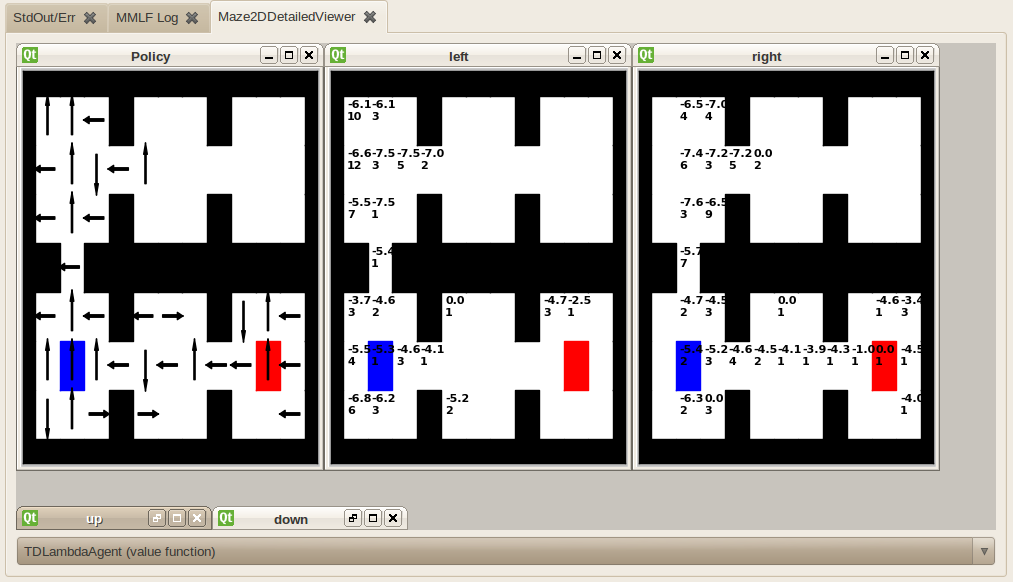
Allows to visualize the policy as well as the Q-function for all available actions in the Maze2D environment. In the Q-function viewer, a separate window is shown for each action. For each state, two values are given: The upper is the current Q-value and the lower one is the number of visits of the states. Note: The number of visits is the number of visits since adding this viewer; thus, it only equals the total number of visits if the viewer is created before starting the world.
- Maze2DFunctionViewer
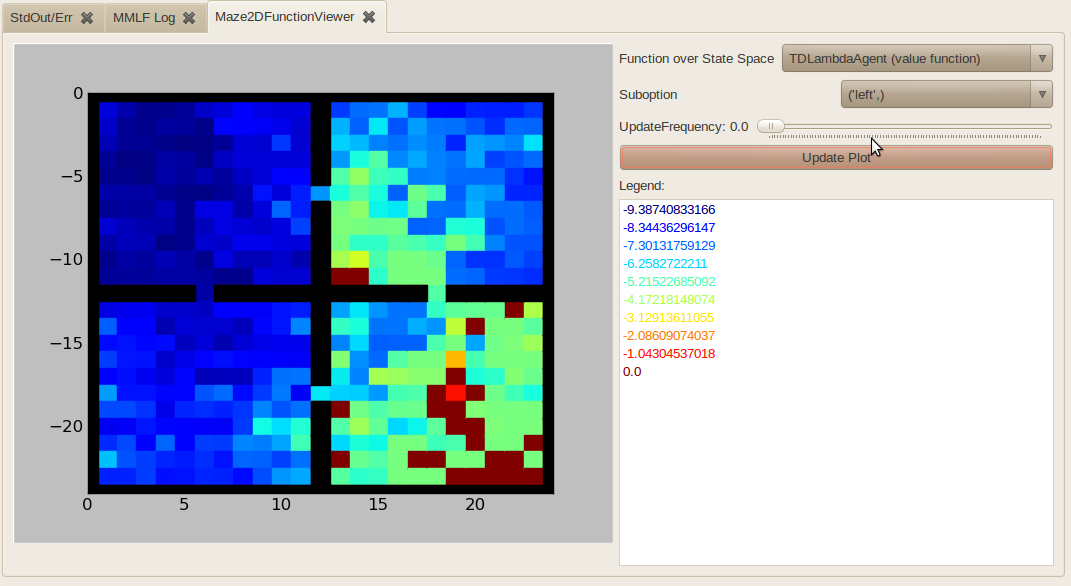
Allows to visualize any FunctionOverStateSpaceObservable or StateActionValuesObservable defined in an agent that is used in combination with the Maze2D environment. For the StateActionValuesObservable, the action to be shown must be selected (called suboption in the GUI). This viewer can either ba updated automatically with a certain frequence, or only manually by pressing “Update Plot” when UpdateFrequency is 0.
- MountainCarPolicyViewer
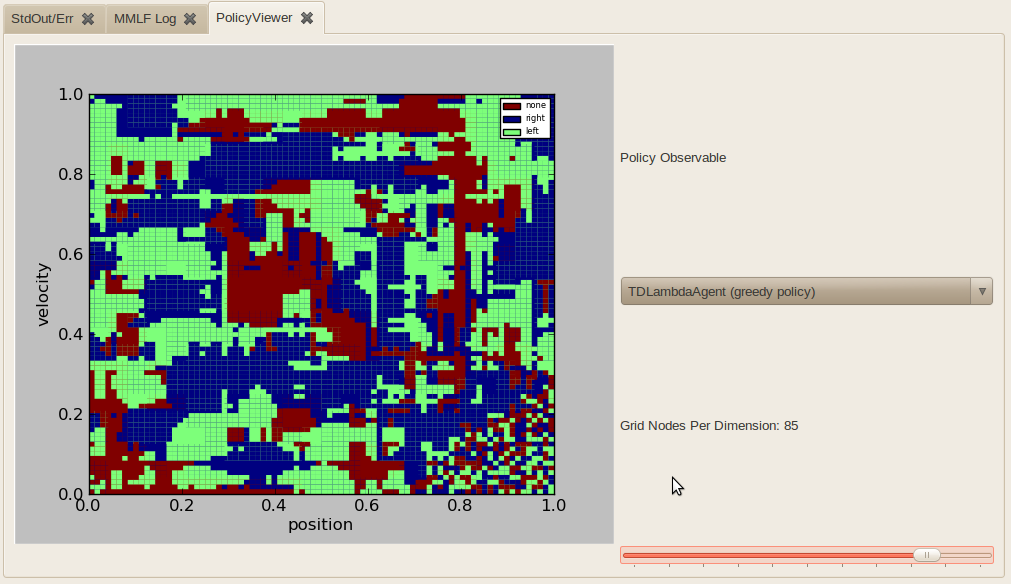
Displays the policy (actually any FunctionOverStateSpaceObservable) over the two dimensional mountain car state space. The policy is evaluated for a grid of N*N equidistand states over the state space. N can be configured using “Grid Nodes Per Dimension”.
- MountainCarValueFunctionViewer
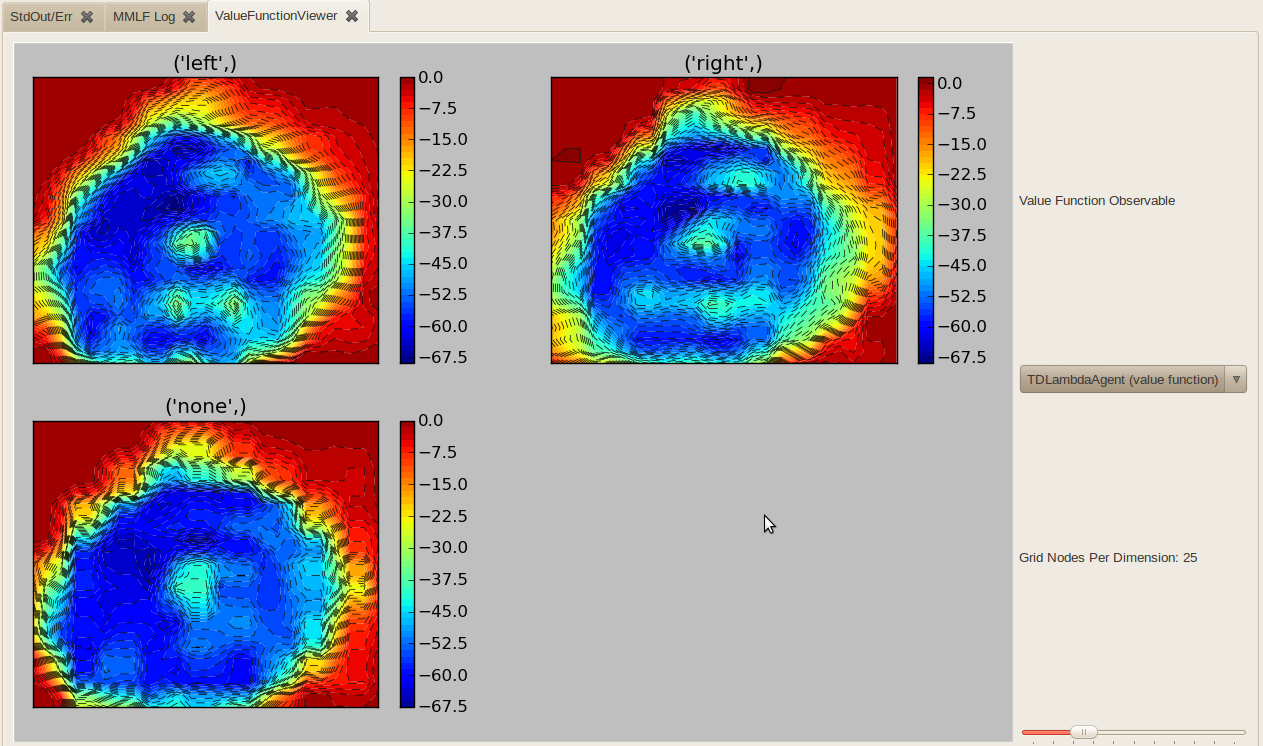
Displays the value function (actually any StateActionValuesObservable) over the two dimensional mountain car state space. The value function is evaluated for a grid of N*N equidistand states over the state space. N can be configured using “Grid Nodes Per Dimension”.
- PinballMazeTrajectoryViewer
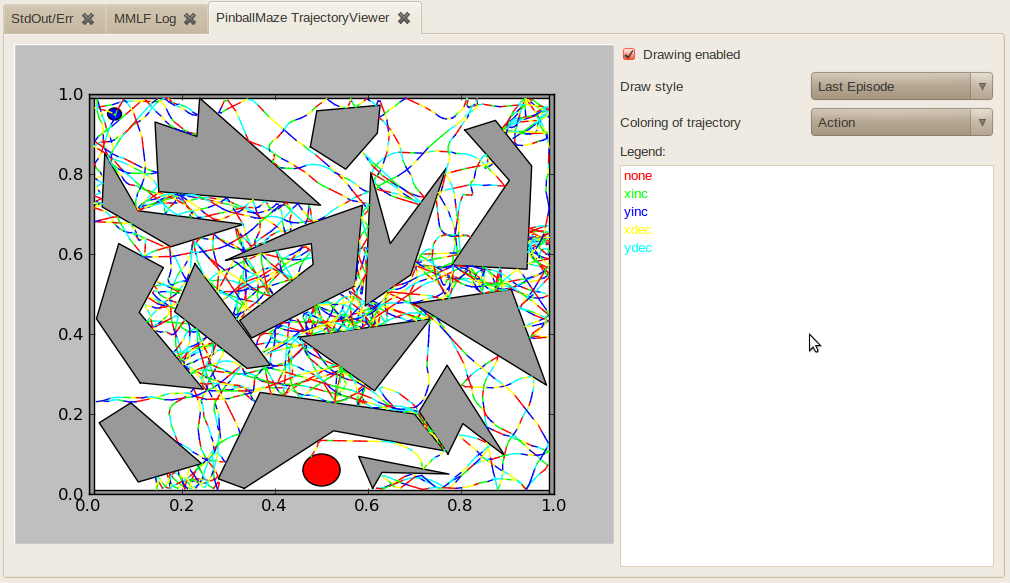
Displays the path of the ball through the pinball maze. Drawing can either be “Last Episode”, which would show the trajectory taken in the last completed episode, “Current Position”, which only shows the current position of the ball, or “Online (All)” which shows the whole trajectory taken by the agent in all episodes since drawin has been started. The trajectory can be coloured either according to the taken action, the obtained reward or the value of the value function.
- PinballMazeFunctionViewer
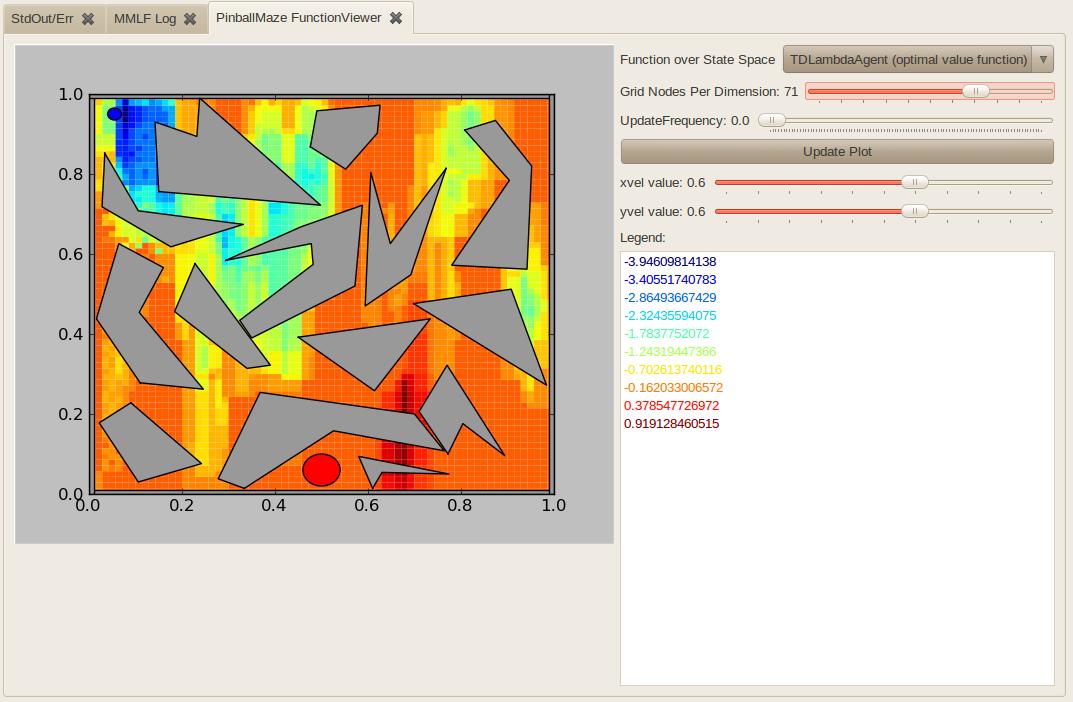
Shows a two-dimensional slice of a FunctionOverStateSpaceObservable in the pinball domain. The two dimensions shown are the x and y position. The values for the two velocity dimensions must be explicitly specified.
- SeventeenAndFourValueFunctionViewer
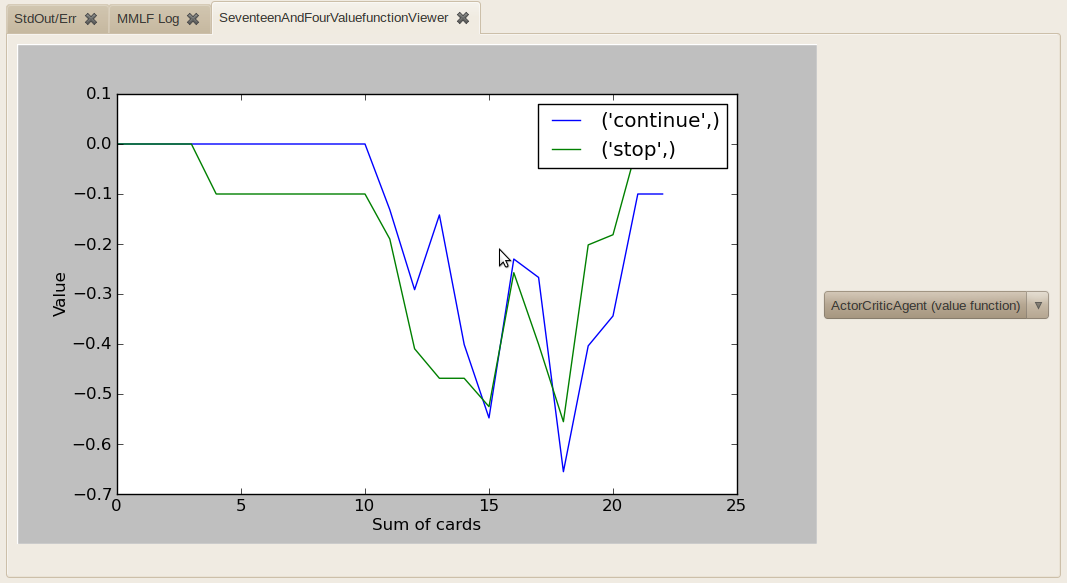
Visualizes an arbitrary StateActionValuesObservable (e.g. an agent’s value function) in the Seventeen and Four domain.
