Logging
Basic logging
During execution of a world (a “run”), the MMLF stores several information about the agent’s performance during learning. This information is stored into a subdirectory of the MMLF RW area (the one created during your first run of the MMLF, typically ~/.mmlf). For each run, a new subdirectory is created, for instance for a run in the maze2d environment, this subdirectory might have the path “maze2d/1854587605103575641/20110415_12_19_46_57_4547690801476827566”. The first component of this path is the world package name, the second component the hash value of the joint agent and environment configuration, and the last component consists of the start time of the run and the thread and process id of this run. While this path appears to be overly complex at first glance, it has the following advantages: Several runs of the same world (the same configuration) are automatically stored in the same subdirectory of the world log directory such that it is easier to group many runs of the MMLF into groups of runs with the same world configuration. Since this grouping is done based on the hash value of the actual configuration, one can not mistakenly group together run with different parameter values. Furthermore, using start time and thread and process id as name of the run directory ensures that each run gets assigned automatically a unique directory even when several runs are conducted concurrently.
- The following information are stored:
The world configuration file is stored into the matching subdirectory (maze2d/1854587605103575641 in the example)
Performance measurements of the agent (e.g. reward obtained per episode, episode length) are typically stored by the environment. This measurements go into a subdirectory with the environment class’ name (“Maze2dEnvironment” for instance) and go into files with the ending (”.fso”). These files are structured as follows:
0       1620
1       1188
2       1555
...
The first number in a line corresponds to a time stamp (typically the episode or step index), while the second one correponds to the agent’s performance at this time (for instance the reward accrued during this episode). These files can then later be plotted and analysed using the MMLF experimenter (see Evaluating experiments). Which performance measures are stored depends on which “FloatStreamObservables” are defined in the environment (see Writing an environment). For FloatStreamObservables, one fso file is created. The name of this fso file corresponds to the observables internal name.
Plots of internal components of the agent like policies, models, value function etc. This information is typically stored by the agent into a subdirectory named according to the agent’s name (e.g. TDLambdaAgent). The plots go into a further subdirectory of this agent subdirectory named according to the agent’s components (e.g. greedypolicy, optimalvaluefunction etc.). In this directory, pdf-files with the name “episode_00009.pdf”, episode_00019.pdf”, ... are generated, where “episode_00009.pdf” contains a plot of the component after the 9th episodes. Which internal components are plotted and with which frequency depends on the monitor’s configuration (see below). The generated graphics are similar to those generated by the viewers (see Viewers).
The policy followed by the agent at a certain time. This policy is stored in a serialized form (pickled). It goes into the subdirectory “policy” of the agent log directory. The files “policy_0”, “policy_1”, ... contain the policy folloewd by the agent at the end of episode 0, 1,...
Monitor
- The Monitor controls which information is automatically stored during a run of the MMLF. This information is stored in the RW-area of the MMLF (see above) and may include:
- performance measures of an agent
- pickling of an agent’s policy
- creating periodically plots of selected StateActionValuesObservable
- creating periodically plots of selected FunctionOverStateSpaceObservable
- creating periodically plots of selected ModelObservable
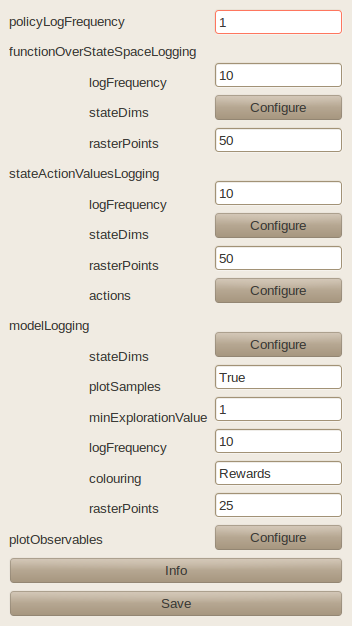
The monitor can either be configured in the MMLF Explorer GUI (see image below) or in the world configuration file when running MMLF in a non-graphical way:
monitor:
 plotObservables: All
 policyLogFrequency: 1
 functionOverStateSpaceLogging:
   active : True
   logFrequency: 10
   rasterPoints: 50
   stateDims: null
 modelLogging:
   active : True
   colouring: Rewards
   logFrequency: 10
   minExplorationValue: 1
   plotSamples: true
   rasterPoints: 25
   stateDims: null
 stateActionValuesLogging:
   active : True
   actions: null
   logFrequency: 10
   rasterPoints: 50
   stateDims: null
See the automatically generated documentation of the Monitor class below for an explanation of the different parameters. When specifying a world using a world configuration file, one may skip the functionOverStateSpaceLogging, modelLogging, and stateActionValuesLogging blocks. This causes the MMLF to not store any plots for the corresponding observables.
Note
If a world configuration file is loaded in which one of the blocks functionOverStateSpaceLogging, modelLogging, and stateActionValuesLogging is skipped, it is not yet possible to add it via the GUI configuration dialog for the monitor.
- class framework.monitor.Monitor(world, configDict)
Monitor of the MMLF.
The monitor supervises the execution of a world within the MMLF and stores certain selected information periodically. It always stores the values a FloatStreamObservable takes on into a file with the suffix “fso”. For other observables (FunctionOverStateSpaceObservable, StateActionValuesObservable, ModelObservable) a plot is generated and stored into files if this is specified in the monitor’s config dict (using functionOverStateSpaceLogging, stateActionValuesLogging, modelLogging).
- CONFIG DICT
policyLogFrequency: : Frequency of storing the agent’s policy in a serialized version to a file. The policy is stored in the file policy_x in the subdirectory “policy” of the agent’s log directory where x is the episodes’ numbers. plotObservables: : The names of the observables that should be stored to a file. If “All”, all observables are stored. Defaults to “All” (also if plotObservables is not specified in a config file). stateActionValuesLogging: : Configuration of periodically plotting StateActionValuesObservables. Examples for StateActionValuesObservable are state-action value functions or stochastic policies. The plots are stored in the file episode_x.pdf in a subdirectory of the agent’s log directory with the observable’s name where x is the episodes’ numbers. functionOverStateSpaceLogging: : Configuration of periodically plotting FunctionOverStateSpaceObservables. Examples for FunctionOverStateSpaceObservable are state value functions or deterministic policies. The plots are stored in the file episode_x.pdf in a subdirectory of the agent’s log directory with the observable’s name where x is the episodes’ numbers. modelLogging: : Configuration of periodically plotting ModelObservables. Examples for ModelObservables are models. The plots are stored in the file episode_x.pdf in a subdirectory of the agent’s log directory with the observable’s name where x is the episodes’ numbers. active: : Whether the respective kind of logging is activated logFrequency: : Frequency (in episodes) of creating a plot based on the respective observable and storing it to a file. stateDims: : The state space dimensions that are varied in the plot. All other state space dimensions are kept constant. If None, the stateDims are automatically deduced. This is only possible under specific conditions (2d state space) actions: : The actions for which separate plots are created for each StateActionValuesObservable. rasterPoints: : The resolution (rasterPoint*rasterPoint) of the plot in continuous domain. colouring: : The background colouring of a model plot. Can be either “Rewards” or “Exploration”. If “Rewards”, the reward predicted by the model is used for as background, while for “Exploration”, each state-action pair tried at least minExplorationValue times is coloured with one colour, the others with an other colour. plotSamples: : If true, the state-action pairs that have been observed are plotted into the model-plot. Otherwise the model’s predictions. minExplorationValue: : If the colouring is “Exploration”, each state-action pair tried at least minExplorationValue times is coloured with one colour, the others with an other colour.
